Candlestick Patterns In Forex Explained by Bcapital

Whether you are new to forex trading or not, learning candlestick formations is a critical part of understanding the technical analysis of all trading. Learning and comprehending candlestick patterns, therefore, will give the forex trader an edge in his or her trading.
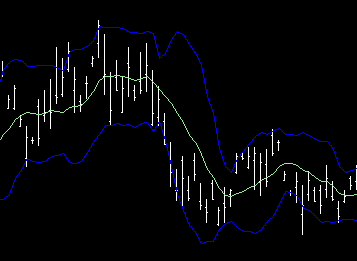
The candlestick chart is the primary tool of the technical analyst. It is used extensively in forex trading to provide a richer context on the relative currency values of any given pair. One candlestick will indicate the open, close, high, low, and direction of a pair in any given time frame the trader selects. If the body of the candle is black or red, it means a currency closed lower than its open. If the body is clear or green, it closed higher. These candles taken together form an even more insightful picture as to market conditions relative to a specific pair. In this way, candlestick charts provide far more value than a traditional line chart.

While there are countless patterns one can learn while mastering candlesticks, the three primary candlestick patterns used in forex include, Spinning Tops, Marubozu, and the Doji. Let us examine these three in more detail:
Candlesticks with small bodies and long upper and lower shadows are called spinning tops. Such candlesticks indicate market indecision. The color of the body is only relevant in the regards to the direction of the trend prior to the spinning top’s appearance. If it appears at the top of an uptrend, it may be signaling less buying sentiment. At the end of a downtrend, less sellers. In this way, spinning tops provide a clue to the trader that a reversal of trend direction may be about to happen.
A Marubozu candlestick is one which is all body and no shadows. In other words, the high and low were the same as the open and close. A clear or green Marubozu means that buyers held control the entire time frame. A red or black Marubozu means the sellers did. It can indicate a continuation of the trend or a reversal depending on whether or not the trend was in the same direction as the candle.
The Doji is perhaps the most well known of all Japanese candlestick patterns. It is the exact opposite of the Marubozu. A doji will possess no or little body, which appears as line, only shadows. This is because the opening price is the same as the close. Like spinning tops, Doji’s indicate market indecision and should be used as a clue for potential trend reversal.
Candlesticks supply the trader with more information than any other price chart making them a favorite for forex traders worldwide. By using and understanding these patterns, forex traders can anticipate future market movement within any given currency pair. Because trading is risky and often unpredictable, candlesticks obviously will not provide definitive answers as to price direction, but they certainly can be a valuable tool to any forex trader. It is best to use candlestick patterns along with other tools such as fibonacci retracement or fundamental analysis to gain a more thorough understanding of potential movement.
BCapital is a leading forex brokerage looking to help make your trading all the more successful. For more information on understanding both candlestick patterns and the forex market, visit their site regularly.